 San Salvador, El Salvador.
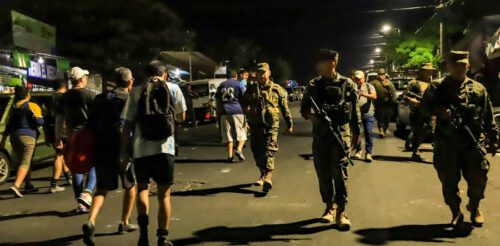
Over the last few years, El Salvador has made tremendous strides in security improvement. The country has gone from one of the most dangerous in Latin America to one of the safest—if not the safest.
As of today, the country’s homicide rate stands at 0.19 per day or 1.13 per 100,000 people. If this safety trend continues, El Salvador could close the year with only 68 homicides—something unthinkable five years ago.

According to the Salvadoran National Police’s (PCN) X social media account, the most dangerous places in El Salvador in 2025 are Tacuba, Antiguo Cuscatlan, Atiquizaya, San Miguel, Jiquilisco, Cojutepeque, Ciudad Delgado, Usulutan, Metapan, and the city of San Salvador.
| Place | Municipality | Department | Population | 2025 Homicides | Homicides per 100,000 Inhabitants | |
|---|---|---|---|---|---|---|
| 1 | Tacuba | Ahuachapan Center | Ahuachapan | 31,865 | 1 | 3.14 |
| 2 | Antiguo Cuscatlan | La Libertad East | La Libertad | 38,058 | 1 | 2.63 |
| 3 | Atiquizaya | Ahuachapan North | Ahuachapan | 40,161 | 1 | 2.49 |
| 4 | San Miguel | San Miguel Center | San Miguel | 214,677 | 5 | 2.33 |
| 5 | Jiquilisco | Usulutan West | Usulutan | 49,911 | 1 | 2.00 |
| 6 | Cojutepeque | Cuscatlan South | Cuscatlan | 54,969 | 1 | 1.82 |
| 7 | Ciudad Delgado | San Salvador Center | San Salvador | 123,429 | 2 | 1.62 |
| 8 | Usulutan | Usulutan East | Usulutan | 71,300 | 1 | 1.40 |
| 9 | Metapan | Santa Ana North | Santa Ana | 72,378 | 1 | 1.38 |
| 10 | San Salvador | San Salvador Center | San Salvador | 335,070 | 4 | 1.19 |
The ranking of the most dangerous places in El Salvador is determined based on the homicide rate per 100,000 inhabitants in districts with a population exceeding 30,000 people.
The most dangerous places in El Salvador homicide stats do not include the deaths of alleged gang members who died while in confrontation with Salvadoran security forces.
Click here to see and compare the most dangerous places in El Salvador in the previous years, 2021 to 2024.
SEE ALSO: El Salvador Homicide Rate and Days Without Homicides in El Salvador
2025 Most Dangerous Municipalities in El Salvador
The most dangerous municipalities in El Salvador in 2025 are La Union North, San Miguel Center, Santa Ana North, Morazán North, Ahuachapán North, Usulutan West, Cabañas West, La Libertad West, Sonsonate East, and Cuscatlán North.
| Municipality | Department | Population | 2025 Homicides | Homicides per 100,000 Inhabitants | |
|---|---|---|---|---|---|
| 1 | La Union North | La Union | 107,690 | 4 | 3.71 |
| 2 | San Miguel Center | San Miguel | 280,635 | 6 | 2.14 |
| 3 | Santa Ana North | Santa Ana | 101,775 | 2 | 1.97 |
| 4 | Morazan North | Morazan | 63,411 | 1 | 1.58 |
| 5 | Ahuachapan North | Ahuachapan | 72,418 | 1 | 1.38 |
| 6 | Usulutan West | Usulutan | 77,753 | 1 | 1.29 |
| 7 | Cabañas West | Cabañas | 84,663 | 1 | 1.18 |
| 8 | La Libertad West | La Libertad | 180,850 | 2 | 1.11 |
| 9 | Sonsonate East | Sonsonate | 188,848 | 2 | 1.06 |
| 10 | Cuscatlan North | Cuscatlan | 105,825 | 1 | 0.94 |
SEE ALSO: Is El Salvador Safe to Visit? A Comprehensive Safety Guide for Travelers
The most dangerous areas in El Salvador, including specific districts or municipalities, can vary from year to year. Additionally, a low homicide rate in a particular location does not necessarily indicate that it is safe for either locals or tourists.
Most Dangerous Places in El Salvador 2021-2024
2024 Most Dangerous Places in El Salvador
| Place | Municipality | Department | Population | 2024 Homicides |
Homicides per 100,000 Inhabitants |
|
|---|---|---|---|---|---|---|
| 1 | Quezaltepeque | La Libertad North | La Libertad | 65,605 | 3 | 4.57 |
| 2 | San Miguel | San Miguel Center | San Miguel | 214,677 | 9 | 4.19 |
| 3 | San Juan Opico | La Libertad Center | La Libertad | 90,198 | 3 | 3.33 |
| 4 | Ahuachapan | Ahuachapan Center | Ahuachapan | 126,730 | 4 | 3.16 |
| 5 | Metapan | Santa Ana North | Santa Ana | 72,378 | 2 | 2.76 |
| 6 | Cuscatancingo | San Salvador East | San Salvador | 75,767 | 2 | 2.64 |
| 7 | Colon | La Libertad West | La Libertad | 120,819 | 3 | 2.48 |
| 8 | Zacatecoluca | La Paz east | La Paz | 83,076 | 2 | 2.41 |
| 9 | Soyapango | San Salvador East | San Salvador | 258,445 | 6 | 2.32 |
| 10 | San Martin | San Salvador East | San Salvador | 92,661 | 2 | 2.16 |
| Municipality | Department | Population | 2024 Homicides |
Homicides per 100,000 Inhabitants |
|
|---|---|---|---|---|---|
| 1 | Chalatenango South | Chalatenango | 67,358 | 3 | 4.45 |
| 2 | Ahuachapan South | Ahuachapan | 114,603 | 5 | 4.36 |
| 3 | La Libertad North | La Libertad | 99,065 | 4 | 4.04 |
| 4 | La Union North | La Union | 107,690 | 4 | 3.71 |
| 5 | San Miguel North | San Miguel | 81,520 | 3 | 3.68 |
| 6 | San Miguel Center | San Miguel | 280,635 | 9 | 3.21 |
| 7 | Morazan North | Morazan | 63,411 | 2 | 3.15 |
| 8 | San Miguel West | San Miguel | 102,016 | 3 | 2.94 |
| 9 | La Libertad West | La Libertad | 180,850 | 5 | 2.76 |
| 10 | La Paz Center | La Paz | 129,767 | 3 | 2.31 |
2023 Most Dangerous Places in El Salvador
| Place | Municipality | Department | Population | 2023 Homicides |
Homicides per 100,000 Inhabitants |
|
|---|---|---|---|---|---|---|
| 1 | San Vicente | San Vicente South | San Vicente | 56,724 | 6 | 10.58 |
| 2 | Acajutla | Sonsonate West | Sonsonate | 58,442 | 4 | 6.84 |
| 3 | Cuscatancingo | San Salvador East | San Salvador | 75,767 | 4 | 5.28 |
| 4 | San Salvador | San Salvador Center | San Salvador | 335,070 | 14 | 4.18 |
| 5 | Santa Ana | Santa Ana Center | Santa Ana | 250,318 | 9 | 3.60 |
| 6 | San Juan Opico | La Libertad Center | la Libertad | 90,189 | 3 | 3.33 |
| 7 | Quezaltepeque | La Libertad North | La Libertad | 65,605 | 2 | 3.05 |
| 8 | Usulutan | Usulutan East | Usulutan | 71,300 | 2 | 2.81 |
| 9 | Ciudad Arce | La Libertad Center | La Libertad | 72,378 | 2 | 2.76 |
| 10 | Soyapango | San Salvador East | San Salvador | 258,445 | 7 | 2.71 |
| Municipality | Department | Population | 2023 Homicides |
Homicides per 100,000 Inhabitants |
|
|---|---|---|---|---|---|
| 1 | La Union South | La Union | 120,969 | 10 | 8.27 |
| 2 | Cabañas East | Cabañas | 68,908 | 5 | 7.26 |
| 3 | Sonsonate West | Sonsonate | 58,442 | 4 | 6.84 |
| 4 | San Vicente South | San Vicente | 106,480 | 7 | 6.57 |
| 5 | San Miguel West | San Miguel | 102,016 | 5 | 4.90 |
| 6 | Usulutan East | Usulutan | 159,251 | 7 | 4.40 |
| 7 | Ahuachapan North | Ahuachapan | 72,418 | 3 | 4.14 |
| 8 | Chalatenango Center | Chalatenango | 83,077 | 3 | 3.61 |
| 9 | Santa Ana Center | Santa Ana | 250,318 | 9 | 3.60 |
| 10 | Ahuachapan South | Ahuachapan | 114,603 | 4 | 3.49 |
2022 Most Dangerous Places in El Salvador
| Municipality Department |
Population | 2022 Homicides |
Homicides per 100,000 Inhabitants |
|
|---|---|---|---|---|
| 1 | Izalco Sonsonate |
86,085 | 19 | 22.07 |
| 2 | Nahuizalco Sonsonate |
59,245 | 12 | 20.25 |
| 3 | Quezaltepeque La Libertad |
65,573 | 9 | 13.73 |
| 4 | Ciudad Delgado San Salvador |
123,258 | 15 | 12.17 |
| 5 | San Miguel San Miguel |
215,597 | 26 | 12.06 |
| 6 | Ahuachapan Ahuachapan |
125,544 | 15 | 11.95 |
| 7 | Santa Ana Santa Ana |
251,095 | 30 | 11.95 |
| 8 | Ilobasco Cabañas |
69,096 | 8 | 11.58 |
| 9 | La Libertad La Libertad |
53,324 | 6 | 11.25 |
| 10 | Colon La Libertad |
120,088 | 12 | 9.99 |
2021 Most Dangerous Places in El Salvador
| Place | Population | 2021 Homicides |
Homicides per 100,000 Inhabitants |
|
|---|---|---|---|---|
| 1 | Ciudad Delgado San Salvador |
123,258 | 45 | 36.6 |
| 2 | Apopa San Salvador |
155,466 | 43 | 27.6 |
| 3 | San Salvador San Salvador |
335,982 | 91 | 27.0 |
| 4 | Colon La Libertad |
120,088 | 26 | 21.8 |
| 5 | Ilopango San Salvador |
119,327 | 21 | 17.6 |
| 6 | Mejicanos San Salvador |
135,556 | 24 | 17.6 |
| 7 | Ahuachapan Ahuachapan |
124,421 | 20 | 16.1 |
| 8 | San Miguel San Miguel |
216,800 | 26 | 12.0 |
| 9 | Santa Ana Santa Ana |
251,095 | 29 | 11.5 |
| 10 | Tonacatepeque San Salvador |
103,096 | 9 | 8.7 |
SEE ALSO: El Salvador’s Challenges and Concerns: What Concerns Salvadorans the Most?