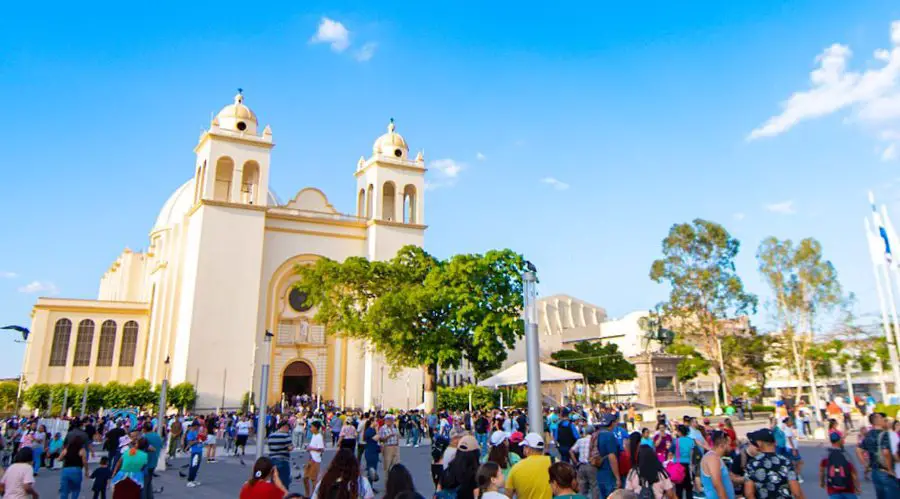
 Downtown San Salvador.
Remittances to El Salvador continue to boost the country’s economy. In March alone, Salvadorans abroad sent $910.8 million, a 5.5% increase—about $47.8 million more than the same month in 2025.
The upward trend is also reflected in cumulative figures, with the country receiving roughly $2.4 billion in the first three months of the year, an increase compared to the same period over the past three years.
According to the Central Reserve Bank of El Salvador (BCR), remittance inflows thus far have increased by 7.3%, up $165.9 million from the same period in 2025.
| 2023 | 2024 | 2025 | 2026 | Change Same Month a Year Ago |
|
|---|---|---|---|---|---|
| January | 602.2 | 599.9 | 676.3 | 759.5 | 83.2 (12.3%%) |
| February | 612.8 | 631.5 | 730.4 | 765.3 | 35.0 (4.8%) |
| March | 721.9 | 688.4 | 863.1 | 910.8 | 47.8 (5.5%) |
| April | 672.6 | 749.4 | 807.2 | ||
| May | 761.4 | 763.8 | 899.1 | ||
| June | 695.2 | 669.1 | 865.4 | ||
| July | 699.5 | 714.0 | 872.9 | ||
| August | 682.8 | 709.1 | 825.0 | ||
| September | 674.1 | 683.1 | 819.7 | ||
| October | 694.5 | 732.4 | 853.0 | ||
| November | 657.8 | 706.3 | 814.8 | ||
| December | 800.7 | 832.7 | 961.1 | ||
| Totals “Millions” | 8275.4 | 8479.7 | 9987.9 | 2435.6 | 7.3% *YTD |
The United States remains the largest source of remittances to El Salvador, contributing $2.2 billion so far in 2026—equivalent to 92.3% of the total.
Canada follows with $20.4 million (0.8%), while Spain ranks third with $17.9 million (0.7%) and Italy comes fourth with $15.8 million (0.7%).
Crypto Wallet Remittances to El Salvador
After a period of decline, the Central Reserve Bank of El Salvador (BCR) reports that remittances sent through cryptocurrency wallets have increased by 49.7% in the first three months of 2026.
Between January and March, crypto remittances reached $17.4 million, up from $11.6 million during the same period last year.
Despite the sharp increase, these transactions remain marginal, accounting for just 0.7% of total remittances. In 2025, they accounted for just 0.6% of total remittances.
| 2023 | 2024 | 2025 | 2026 | Change Same Month a Year Ago |
|
|---|---|---|---|---|---|
| January | 8.4 | 6.8 | 2.4 | 5.6 | 3.1 (127.9%) |
| February | 7.6 | 6.4 | 2.3 | 6.0 | 3.8 (166.7%) |
| March | 8.5 | 8.0 | 6.9 | 5.8 | -1.1 (-15.9%) |
| April | 7.5 | 7.7 | 4.4 | ||
| May | 7.7 | 6.8 | 4.6 | ||
| June | 7.0 | 6.8 | 4.8 | ||
| July | 6.5 | 7.2 | 4.9 | ||
| August | 6.3 | 7.7 | 5.2 | ||
| September | 6.0 | 7.2 | 4.7 | ||
| October | 5.4 | 7.2 | 5.7 | ||
| November | 5.5 | 6.6 | 6.2 | ||
| December | 6.6 | 7.2 | 5.6 | ||
| Totals “Millions” | 82.9 | 85.5 | 57.7 | 17.4 | 49.7% *YTD |
Remittances by Department
As of March 2026, the San Salvador department leads the country in remittance inflows, receiving 18.3% of the national total, or $446.1million.
Remittances to the San Salvador department have increased by 4.5%, compared to the same period in 2025—a $19.4 million increase.
On the other hand, Cuscatlán remains the department with the lowest share, accounting for 2.8% of total remittances, or $68.4 million.
- San Salvador 446.1
- San Miguel 270.6
- La Libertad 208.4
- Santa Ana 190.5
- Usulután 183.9
- La Unión 170.5
- Chalatenango 146.5
- Sonsonate 126.0
- Morazán 106.1
- Cabañas 106.0
- La Paz 103.3
- Ahuachapán 102.4
- San Vicente 83.0
- Cuscatlán 68.4
Remittances by Municipalities
The San Salvador Center municipality has received the highest volume of remittances so far this year, totaling $267.0 million, or 11% of the national figure, an increase of $15.0 million compared to the same period in 2025.
In contrast, the Sonsonate North municipality has recorded the lowest amount, receiving $10.9 million, or 0.4% of the total.
Top Five Municipalities
- San Salvador Center 267.0
- San Miguel Center 169.3
- Usulután East 96.1
- San Salvador East 92.5
- La Unión North 90.0
Bottom Five Municipalities
- San Salvador South 19.3
- Chalatenango North 17.5
- Santa Ana East 13.7
- Ahuachapán North 12.4
- Sonsonate North 10.9
Remittances sent to Salvadorans are pivotal in the nation’s economy, providing vital financial support to many families.
Data from the Multiple Purpose Household Survey (EHPM), published by the Salvadoran Ministry of Economy, indicates that 1.6 million Salvadorans benefit from remittances. Many of these people are in extreme poverty or relative poverty.
Remittances have increased steadily in the last decade; they are a big part of El Salvador’s Gross Domestic Product, GDP.