Business and Economy
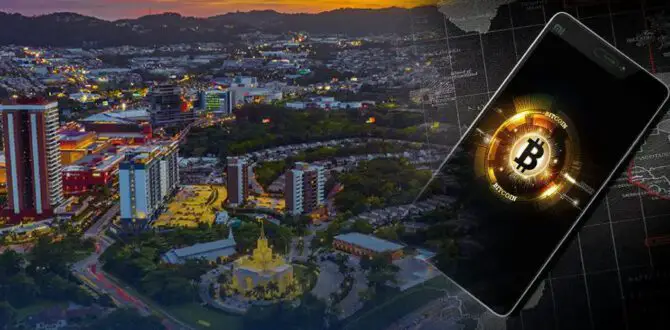
El Salvador Bitcoin Holdings: Government Increases Reserves to 6,224 Coins, Worth About $658.8 Million
SAN SALVADOR — El Salvador continues to acquire Bitcoin for its strategic reserves and has 6,2244 Bitcoins with a current economic value of about $658.8 million—$105,848 per coin at today’s prices. The National Bitcoin Office of El Salvador (ONBTC) published … Read more

El Salvador’s Exports Up 5.4% So Far in 2025, Signaling Positive Economic Momentum
The Central Reserve Bank (BCR) reported that Salvadoran exports have increased by 5.4% in 2025, despite global economic uncertainty stemming from the U.S. trade war with its trading partners. In the first five months of 2025, Salvadoran companies exported goods … Read more
Remittances to El Salvador have Increased by 15.8% in 2025, Fueled by U.S. Contributions
SAN SALVADOR, El Salvador — Remittances to El Salvador continue to fuel the economy, posting strong growth through the first five months of 2025, even as cryptocurrency-based transfers sharply decline, according to new data from the Central Reserve Bank (BCR). … Read more
El Salvador’s Basic Food Basket Increases to $248.22 in May 2025
SAN SALVADOR, El Salvador — Official figures show that rising food costs continue to strain Salvadoran households, with the basic food basket remaining a significant burden despite modest year-over-year price increase. As of May 2025, according to government data, El … Read more
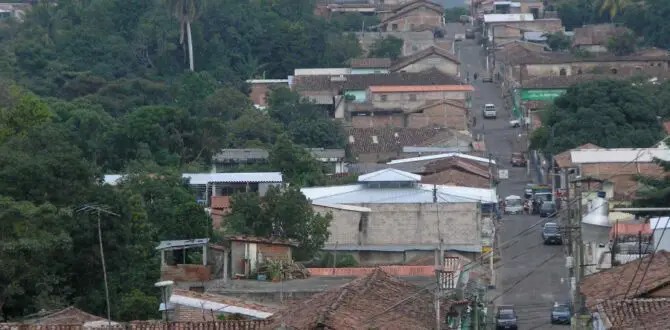
Locals Struggle as El Salvador’s Real Estate Boom Drives Up Costs
In recent years, Salvadoran real estate prices have increased to levels never seen before, primarily due to improved security – safer streets have made the country’s real estate more attractive. However, the rise in property value has left many locals … Read more
World Bank Maintains Its Forecasts of a 2.2% Economic Growth for El Salvador in 2025
SAN SALVADOR, El Salvador — In its June 2025 update to the World Economic Outlook report, the World Bank maintained its economic growth projection for El Salvador at 2.2% in 2025, the lowest rate forecast for Central America. In April, … Read more

The Inflation Rate in El Salvador Drops to -0.21% in May—the Second Lowest Level Since November 2024
SAN SALVADOR, El Salvador — The inflation rate in El Salvador declined to -0.21% in May 2025, marking the second-lowest monthly deflation since November 2024, when the country recorded a -0.31% rate, according to data from the Central Reserve Bank … Read more