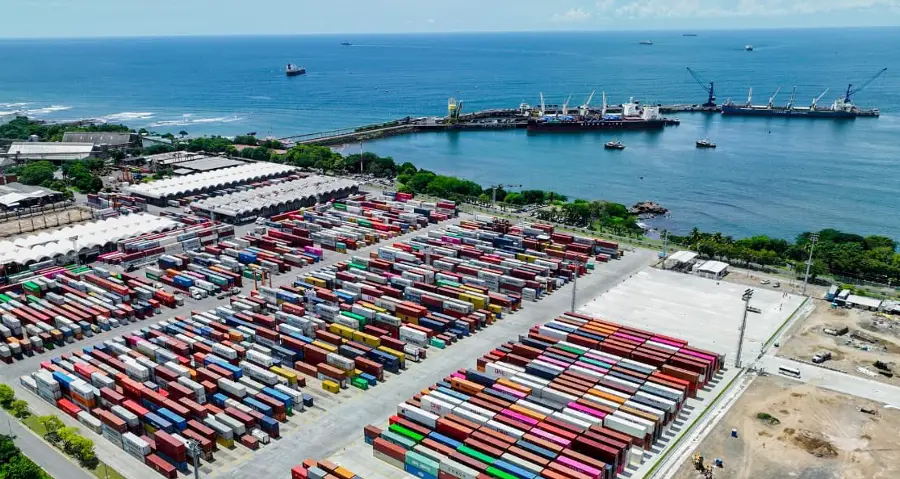
 Acajutla Port El Salvador.
The Central Reserve Bank of El Salvador (BCR) reports that Salvadoran exports have increased by 2.9% in 2026, despite a decline registered in May.
Thus far this year, Salvadoran companies have exported goods worth $2.8 billion, up $78.4 million from the same period last year.
In May 2026, El Salvador exported $555.6 million—a 5% decrease from the same month last year, or $29.4 million less.
| 2023 | 2024 | 2025 | 2026 | Change Same Month a Year Ago |
|
|---|---|---|---|---|---|
| January | 522.6 | 531.1 | 515.8 | 559.4 | 43.7 (8.5%) |
| February | 582.9 | 506.7 | 530.8 | 521.4 | -9.4 (-1.8%) |
| March | 683.7 | 506.8 | 558.6 | 582.6 | 24.0 (4.3%) |
| April | 471.5 | 584.9 | 534.9 | 584.4 | 49.5 (9.3%) |
| May | 589.7 | 565.0 | 585.1 | 555.6 | -29.4 (-5%) |
| June | 588.9 | 501.3 | 540.7 | ||
| July | 568.7 | 561.9 | 600.2 | ||
| August | 539.6 | 519.8 | 523.8 | ||
| September | 502.4 | 519.2 | 521.1 | ||
| October | 495.8 | 555.1 | 541.2 | ||
| November | 503.2 | 529.9 | 510.8 | ||
| December | 449.1 | 429.9 | 465.8 | ||
| Total Billions | 6.5 | 6.3 | 6.4 | 2.8 | 2.9% *YTD |
As of May, exports from the agriculture, livestock, forestry, and fishing sectors have grown by 24.9% representing an increase of $30.1 million compared to the same period last year.
Also, coffee exports—one of El Salvador’s most recognized products—have increased by 37.2% so far in 2026, with the country exporting $34.7 million more than during the same period last year.
Exports Destinations
The United States remains the primary destination for Salvadoran exports. This year, Salvadoran products worth $910.4 million have been shipped to the United States, accounting for 32.5% of the country’s total exports.
According to the Central Reserve Bank(BCR), exports to the U.S. grew by 3.6% between January and May 2026—an increase of $31.6 million compared to the same period last year.
Guatemala is the second-largest destination for Salvadoran products, with exports totaling $543.8 million this year, accounting for 19.4% of total exports. Compared to 2025, exports to Guatemala have increased by $12.4 million, representing a 2.3% increment.
| Country | Exports (Millions) | Percentage | |
|---|---|---|---|
| 1 | United States | 910.4 | 32.5% |
| 2 | Guatemala | 543.8 | 19.4% |
| 3 | Honduras | 435.1 | 15.5% |
| 4 | Nicaragua | 243.2 | 8.7% |
| 5 | Costa Rica | 128.1 | 4.6% |
Central America is the leading destination region for Salvadoran exports. Thus far, the country has exported $1.4 billion to other Central American nations, making up 50% of total exports.
Imports and Trade Deficit
So far this year, El Salvador has imported $7.7 billion in goods, resulting in a trade deficit of $4.9 billion.
The United States remains El Salvador’s top import source, accounting for $2.1 billion (27.5%), followed by China with $1.5 billion (19.8%) and Guatemala with $725.8 million (9.4%).
El Salvador faces a massive trade deficit, highlighting the need for greater export growth and trade balance improvements.